
- BTC/USD closes at $9,400 and confirms the bullish momentum scenario.
- XRP/USD accompanies Bitcoin and also confirms the new favorable scenario.
- ETH/USD is delayed and the bullish exhaustion level is set at $176.5.
Long Bitcoin! The entry into non-bearish territory has been long-awaited news and it has come in an unexpected sequence.
Just as the short term trend was running out, the market finds new money. Bitcoin has broken through the upward resistance that indicated bearish territory from the $13,812 peak recorded on June 26, 2019.
The crypto market has several active bullish patterns:
- Second-tier altcoins are rising sharply.
- Bitcoin, the King, enters potentially bullish territory.
- XRP also confirms the exit from bearish territory.
And Ether?
Ethereum is up 1% on the day and is above the SMA200 for the first time since September 2019. Nevertheless, it remains in the medium-term bearish scenario. The impact of this delay is direct on the market as a whole, as it weighs down the performance of the ETH/BTC pair and its status as a necessary participant in any significant upward movement.
ETH/BTC Daily Chart
The ETH/BTC pair is currently trading at the price level of 0.01893. The weakness of Vitalik Buterin’s brainchild has caused it to miss the EMA50 on Tuesday, and triggered buy notifications at the 0.0180 level.
One should not underestimate the market activity that – leaving aside the dollar or euro value of the market – seeks to multiply the value of its portfolios in Bitcoin. For this part of the market, the time to get long has not yet come.
Above the current price, the first resistance level is at 0.0195, then the second at 0.020 and the third one at 0.022.
Below the current price, the first support level is at 0.0187, then the second at 0.018 and the third one at 0.017.
The MACD on the daily chart shows the overlap of the moving averages. If it reacts similarly to BTC/USD, it should bounce higher and cancel any downward attempt.
The DMI on the daily chart shows that the bulls continue to lose strength even though they remain above the 20 level, which indicates a trend in progress. The bears are stopping the rally but are close to the bulls, too close to deny a takeover attempt.
BTC/USD Daily Chart
BTC/USD is currently trading at $9,336.8 after hitting a session high of $9,431 behind. During the US session, the chart broke the primary downward sloping trend line. The buying side remained firm and confirmed at the end of the day.
The new scenario is now free of the bearish environment and exponentially improves its upward potential.
The situation of the moving averages suggests a lateral upward movement in the short term, with support at $9,600 and perhaps a quick trip to the $10,600 level.
Above the current price, the first resistance level is at $9,600, then the second at $10,600 and the third one at $11,200.
Below the current price, the first support level is at $9,200, then the second at $8,900 and the third one at $8,800.
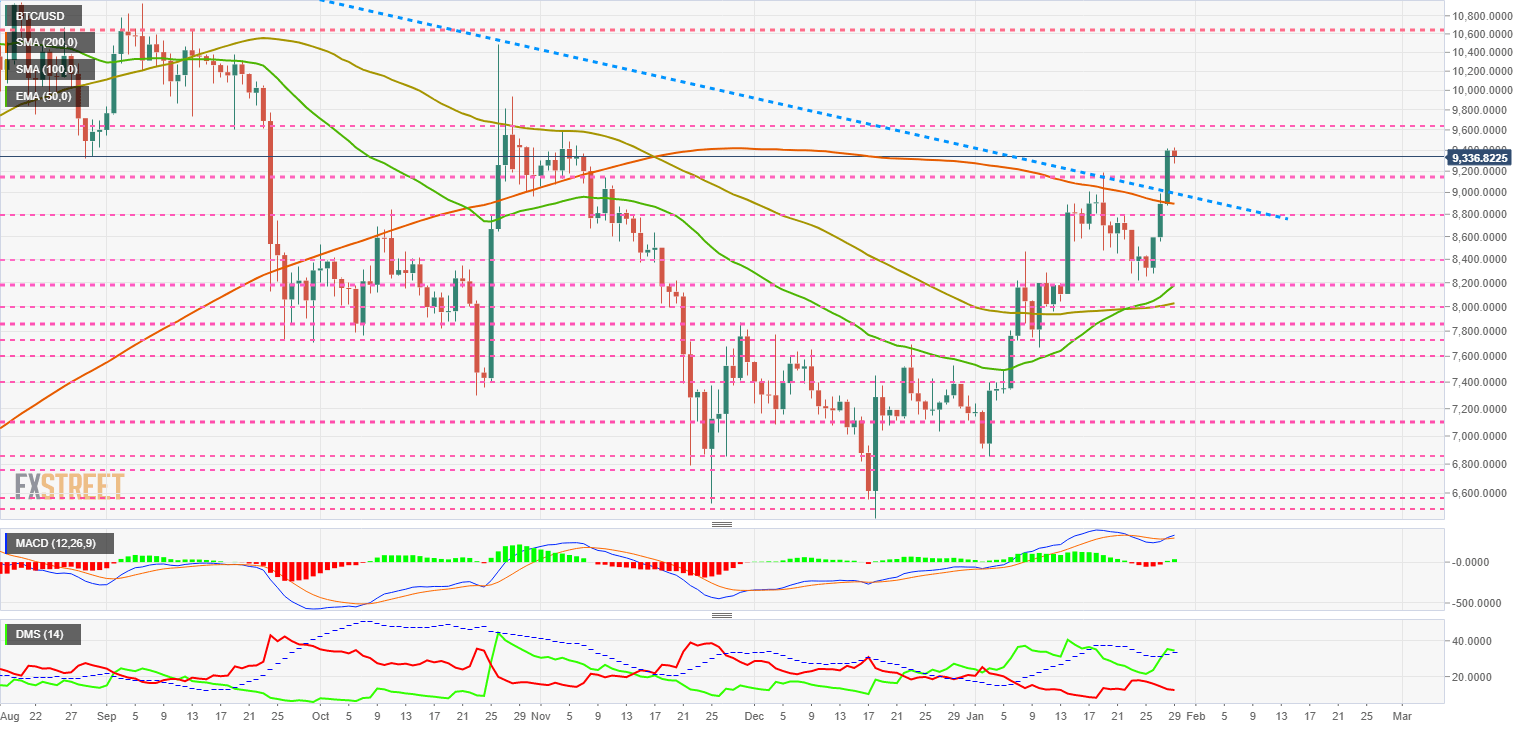 The MACD on the daily chart shows a new bullish cross. Neither the opening between the averages nor the tilt of the lines is powerful.
The DMI indicator on the daily chart is once again above the ADX line and activates the bullish pattern of this indicator.
ETH/USD Daily Chart
ETH/USD is currently trading at $177.04 and is above the SMA200. The Ether is the last top 3 remaining in the bearish scenario, below $187.5 and should not continue much longer in this territory.
Above the current price, the first resistance level is at $180, then the second at $187.5 and the third one at $190.
Below the current price, the first support level is at $175.7, then the second at $170 and the third one at $161.
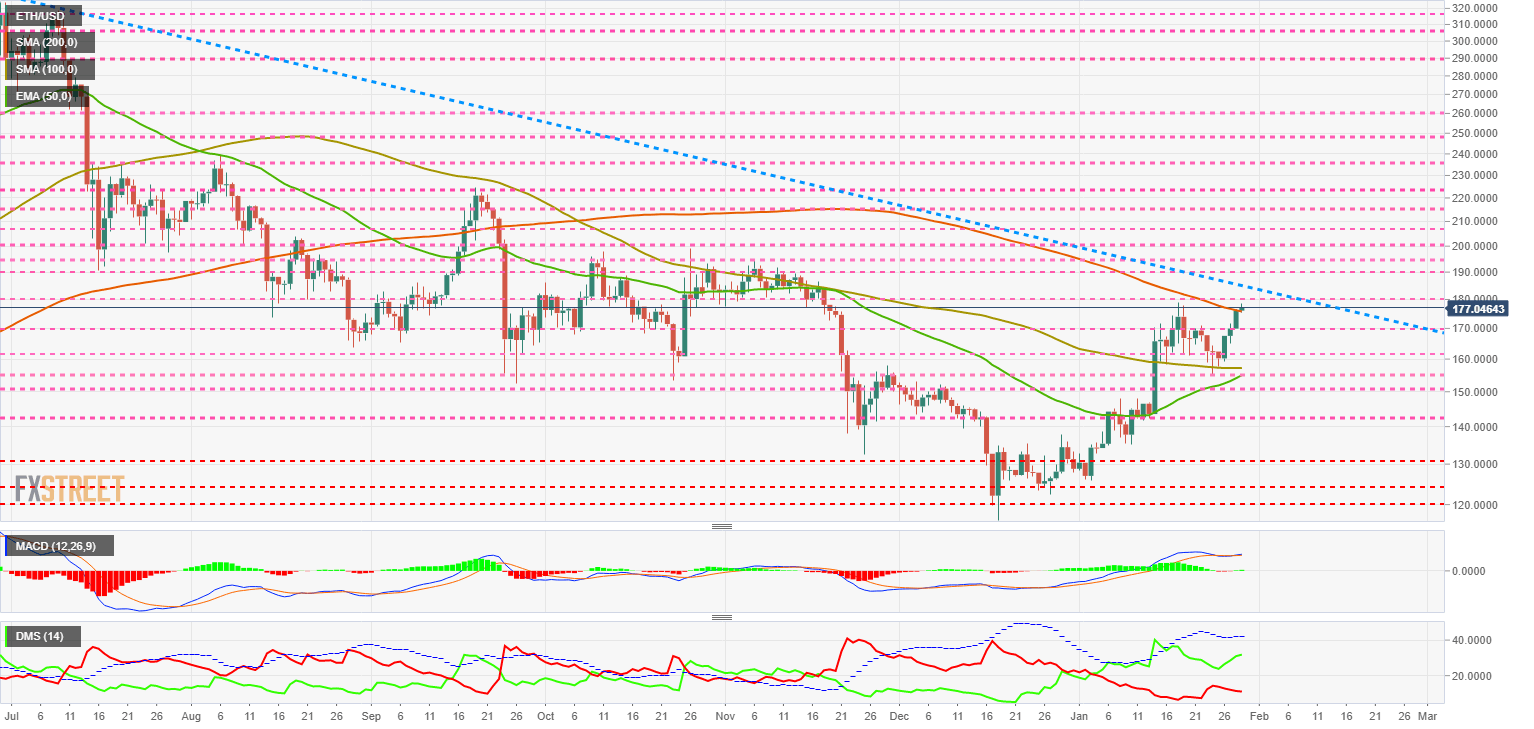 The MACD on the daily chart shows the intention to return to the upside in the coming days. The momentum of the crypto market as a whole may have a strong influence on the behavior of ETH/USD.
The DMI on the daily chart shows a clear bullish profile, with bulls rapidly distancing themselves from bears. The sell-side is far from being able to contest the leadership of the buyers.
XRP/USD Daily Chart
XRP/USD is currently trading at the price level of $0.2384 and is stabilizing above the SMA200 and the long term downward trend line.
Above the current price, the first resistance level is at $0.253, then the second at $0.259 and the third one at $0.267.
Below the current price, the first support level is at $0.237, then the second at $0.227 and the third one at $0.226.
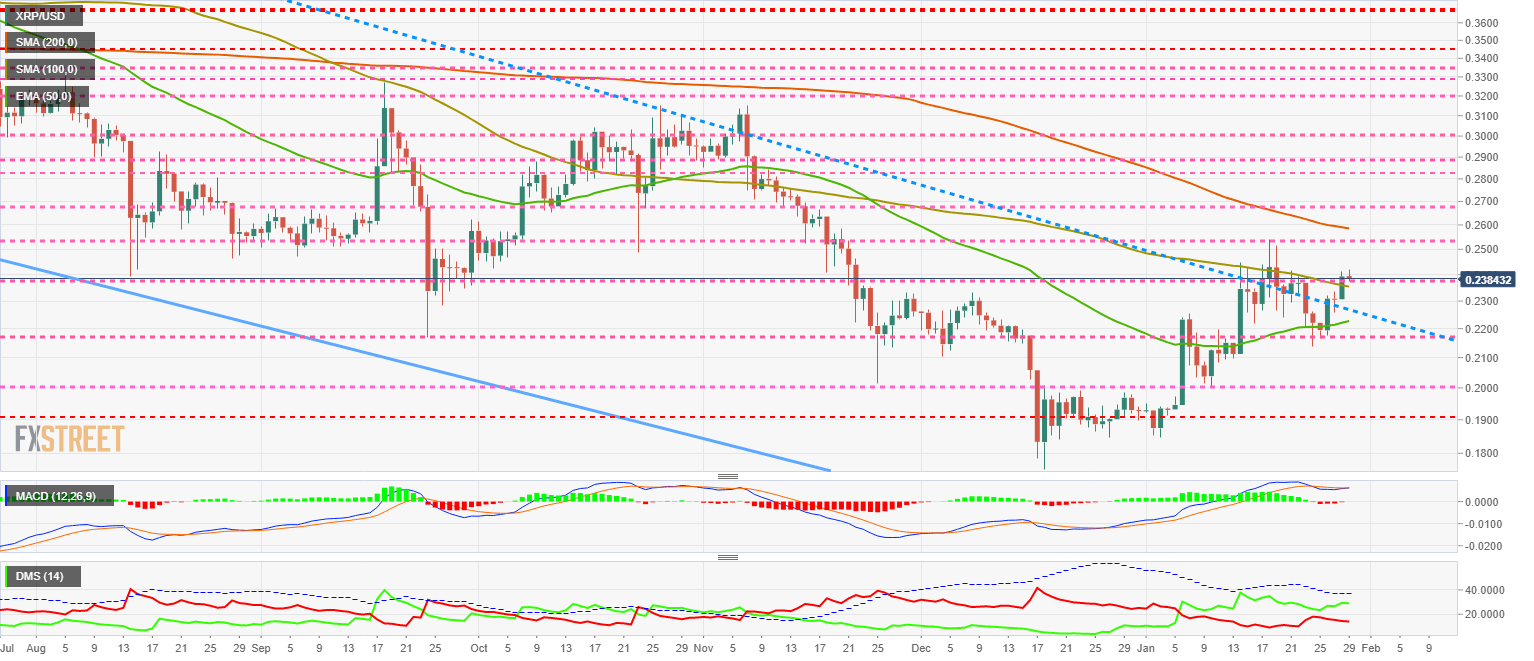 The MACD on the daily chart is in the process of rising again but is not confirmed. The MACD on the daily chart is in the process of growing still but is not confirmed.
The DMI on the daily chart shows bulls controlling the XRP/USD pair with a significant advantage overbears.
Get 24/7 Crypto updates in our social media channels: Give us a follow at @FXSCrypto and our FXStreet Crypto Trading Telegram channel

Be the first to comment