

Cryptocurrencies continued to fell hard during Sunday, and this time altcoins are dropping even harder than Bitcoin (+8.12%). Ethereum, EOS, NEO, and Binance Coin are currently descending over 10%. Amidst all this blood, NavCoin is up 16%. Most of the Ethereum tokens are also dropping hard. MKR dropping close to 20%, but there are some big gainers too, such as DATA( +278%), BCZERO(+130%), and SPIKE(+60.2%).
Fig 1 - 24H Crypto Heat Map
The market capitalization descended to $181.6 billion or -10.17%, a considerable selloff on $38.43 Billion volume, an increment of 32%. As a consequence of altcoins dropping harder than Bitcoin, the Bitcoin Dominance grew to 66.28%.
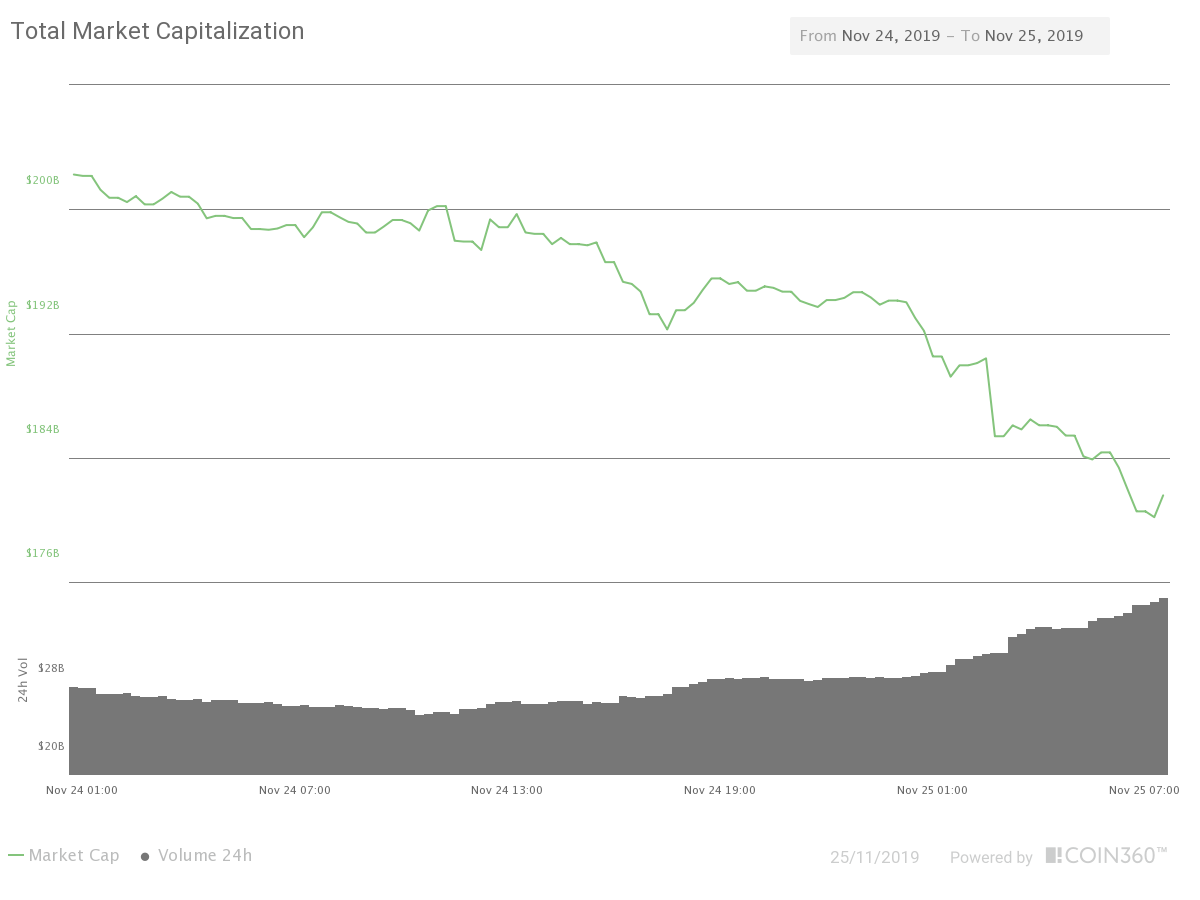
Fig 2 - 24H Market Capitalization
Hot News
The news of the Chinese police raiding Binance offices in Shanghai are completely denied by Binance executives with an unrefutable argument: They stated that they do not have offices in Shanghai.
However, what is a fact is that the Chinese authorities are cracking down on platforms that they claimed are a focus of crypto frauds and Ponzi schemes, and have identified up to 39 platforms trading bitcoin.
Thai Securities and Exchange Commission has plans to tweak its digital asset regulations next year to prepare Thai laws for the coming blockchain and DLT revolution. According to an article by Bitcoinist.com, Secretary-general of the Thai Sec, Ruenvadee Suwanmongkol stated that “Laws should not be outdated and should serve market needs, especially for new digital asset products, and be competitive with the global market. We need to explore any possible obstacles.”
Technical Analysis - Bitcoin
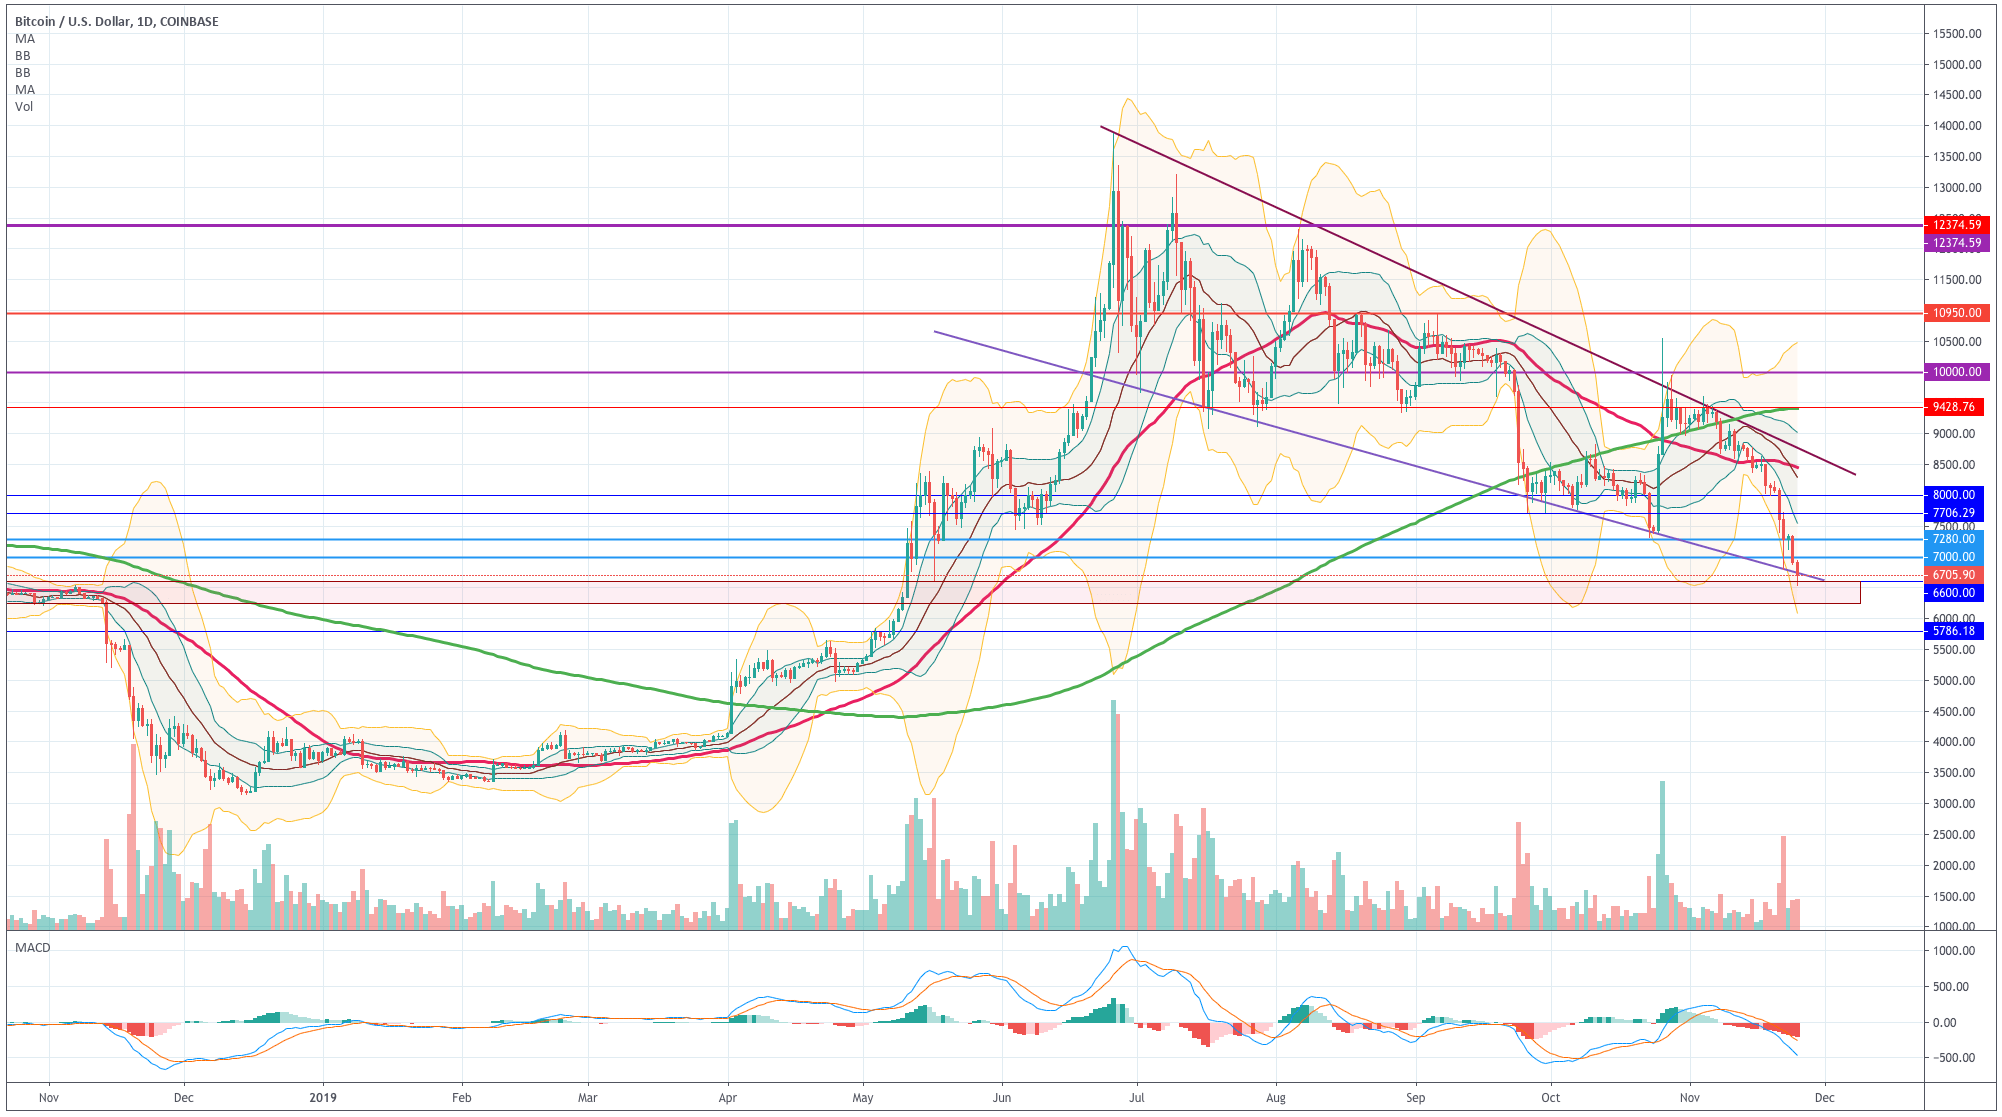
Chart 1 - Bitcoin Daily Chart
Bitcoin has dropped close to 9%, in a movement that brought its price to touch the bottom of the descending wedge. This area coincides with a long-term support area made in October-November, 2018.
We can see in the chart that the price is near the -3SD line of the Bollinger bands, while the MACD is deep into the negative territory. The traded volume of the last two days is relatively low, compared to the previous drop. Taking all this into account, we consider this is an area for a potential bounce.
Chart 2 - Bitcoin 4H Chart
On the 4H chart, we see that the price is making two spikes touching the -3SD Bollinger line. That is a pattern for a short-term bounce. That said, the trend continues to be extremely bearish, its momentum still growing.
The levels to watch are $6,600 and $6,245 to the downside, and $7,000 and $7,300 to the upside.
| Supports | Pivot | Resistances |
| 6,735 | 7,000 | 7,300 |
| 6,550 | 7,500 | |
| 6,245 | 7,700 |
Ripple
Chart 3 - Ripple 4H Chart
Ripple has dropped heavily in the last hours in a spike of volume that put its price down to 0.2025, although currently is bouncing off. The last candlesticks are making wicks at the -3SD Bollinger line, which most of the time, it signals a bounce to the mean line. The potential objective zone is 0.2217. That said, the trend is bearish, and its momentum is growing as we can see by the central line of the Bollinger band curving down more and more. A new visit to the 0.2 or, even, 0.189 is very likely.
| Supports | Pivot | Resistances |
| 0.216 | 0.2263 | 0.232 |
| 0.2 | 0.242 | |
| 0.1895 | 0.25 |
Ethereum
Chart 4 - Ethereum 4H Chart
Ethereum has dropped over 10% in the last 24 hours on heavy volume, its price touching the lows made in April. The current short-term situation of the price is quite oversold, and, as happens with other coins, it is trying to create a consolidation.
The trend is bearish, and this won’t change for a while since the Bollinger bands point sharply to the downside. The trader under these circumstances seeks to sell rallies, and the investor should refrain from buying until signs of a trend change.
| Supports | Pivot | Resistances |
| 135 | 144 | 149 |
| 130 | 159 | |
| 123 | 164 |
Litecoin
Chart 5 - Litecoin 4H Chart
Litecoin continues dropping sharply, its price moving below the -1SD Bollinger line with strong momentum. The price has made a couple of candlesticks with large wicks bouncing off of $42.7, but there is no strength in the buying side. The Next support would come from $41.6, lows created in March. If it does not hold, LTC could be poised to visit $33, made in February, which was the starting point of the 2019 rally.
| Supports | Pivot | Resistances |
| 42.7 | 42.4 | 47.2 |
| 41.6 | 50 | |
| 37.8 | 52 |

Be the first to comment