

Electroneum is a mobile-first cryptocurrency aimed at mass adoption. It is built off Monero codebase to allow for transactions on a decentralized blockchain. It overcomes the shortcomings of bitcoin’s privacy issues. Electroneum’s stealth address, a one-time public key that prevents recipient’s funds from being linked with their wallet, resolves the security issue. The recipient gets their funds through their wallet’s private view key which scans the blockchain. Transactions are faster with dynamic fees which are based on the amount of traffic on the network. The majority of the transactions have less than 0.2 ETN in total fees.
The more interesting feature is the ability to perform mobile mining. The app will allow your phone’s CPU to engage in stimulated mining. Though mobile mining will not confirm the creation of new blocks, however, rewards will be given to the miners.
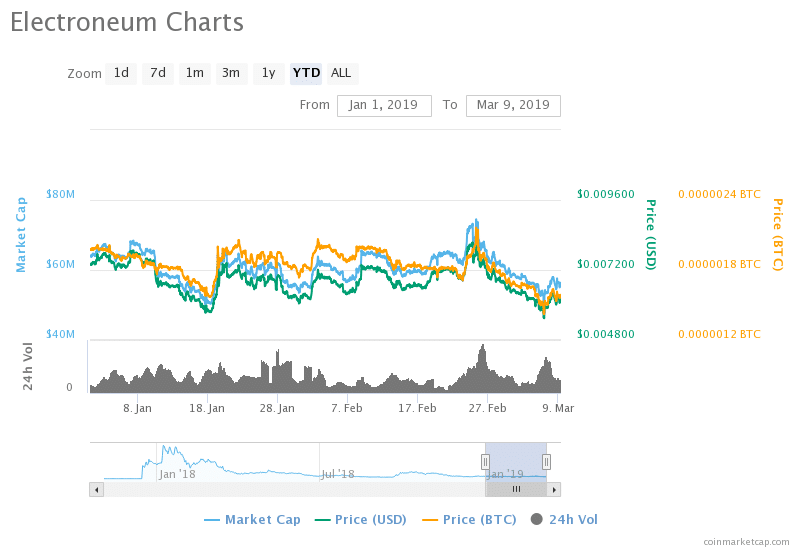
Based on the reports from CoinMarketCap, Electroneum (ETN) is ranked as the 77th cryptocurrency with its market cap value as USD 56,386,460 on March 09, 2019 for the corresponding 24h volume of $199,251 which is relatively lower by 12.08 percent from the value of $64,135,322 USD on February 09 at 11:34 UTC. The overall market has been on a downtrend with inconsequential highs. The market value reached its lowest on March 06 with its MCap value – USD 50,413,782. However, the current value shows that the market hiked 11.85 percent high since then. The 20-day Exponential Moving Average shows that the market is downtrend, with its values dipping from USD 58,696,246 February 17 to the current value by 3.94%. The overall market and the 20-day EMA is being pushed down by the bearish pressure.
CoinMarketCap has also been observing the pricing movements along with the MCap values. The present prices of USD and BTC on March 09, 2019 at 08:54 UTC are $0.006220 and 0.00000159 respectively. Stats show that the MCap and price of USD have been running parallel with the Mcap value lower than the price of USD. The price of BTC has been on a complete sway with values rising and falling sequentially. The peak price of USD so far has been $0.008192 on February 25, and the lowest has been $0.005570 on March 06. The price of BTC started as high as 0.00000197 at the beginning of January 2019 and has dipped 19.29 percent to reach the present-day value. Both the USD pricing and the MCap values have been on a similar wave, with the same level of ups and downs. The numbers have been going downhill after the all-time high and have reached the current value. The cryptocurrency reached its milestone with the price of USD shooting from USD 0.007057 on February 23 to USD 0.008192 on February 25, a 16.08% spectacular hike in 02 days.
The 14-day moving average shows values descending from USD 68,200,500 on February 23 to the current value and a 17.32 percentage decrease. Both the negative averages point the market balance in favor of sellers. Hence, any investors with long term investment plans should observe the market trend before taking a step further. Traders will have to sideline to explore the market further before indulging in any investments. Once the values increase steadily, it will turn out advantageous for the traders, and they will attain more benefit from it.

Be the first to comment