

- The probability of a bullish run has been increasing in the last few hours.
- XRP shows contradictions in analysis, with high uncertainty.
- Litecoin keeps the tone and sets new cycle highs.
We are halfway through the week with the three protagonists of the Crypto market are shining green. All top cryptocurrencies are still consolidating, and the indicators are negative in the short term.
However, today’s leader is the fourth in terms of market capitalization – Litecoin. It is trading around $140 completing a winning streak of six consecutive weeks, rising from the low of early May of approximately $68. The LTC/USD technical setup shows a similar configuration to those it showed during the first week of December 2017.
The ETH/BTC pair, which I consider to be an advanced market indicator, is hovering above the main moving averages at the top of the Bollinger intermediate band.
The right conditions are in place to start seeing a consistent improvement in Ethereum versus Bitcoin – one of the prerequisites I consider necessary to declare once and for all – that the market in bullish territory.
Marcus Swanepoel, CEO at Luno says in a recent market advice:
The main markets appear to be drifting this morning as investors wait for the G-20 meeting and the US Retail CPI figures. This lack of direction is also affecting Bitcoin and Ethereum, which remain trading below their key levels of US$8,000 and US$245 respectively. The sentiment across all altcoins has changed to bearish, so it will take a big push for BTC and ETH to break above these psychological barriers.
ETH/BTC 4-Hours Chart
The ETH/BTC cross is currently trading at the price level of 0.0312 and has difficulty distancing itself from the powerful confluence at the 0.0305 level.
Above the current price, the first resistance level is at 0.0317 (price congestion resistance and upper parallel bullish line), then the second resistance level awaits at 0.0332 (price congestion resistance). The third resistance level for the ETH/BTC pair is at 0.034 (second parallel upper trend line).
Below the current price, the first support level is at 0.0305 (EMA50, SMA100, SMA200), the second one is 0.030 (price congestion support), and the third support level for ETH/BTC is at 0.0292 (price congestion support).
The MACD on the 4-hour chart is just below zero. It is a critical moment, and ultimately, what will decide the future of the market in the short term. If it succeeds in entering the positive zone, the price can fly upwards.
The DMI on the 4-hour chart is positive for bulls. They move freely above the ADX indicator and would have no impediment to developing an upward movement. Bears confirm this feeling with a clear downward trajectory.
BTC/USD Daily Chart
BTC/USD is trading at $7,917 without being able to overcome the price congestion resistance of $8,000. The long term bearish channel ceiling is at $8,150. A small distance in price but huge in terms of the effect it would have on the market.
Above the current price and beyond the two resistance levels already commented, the next resistance level for the BTC/USD pair is $8,450 (price congestion resistance), then the second resistance level is $8,800 (price congestion resistance). The third resistance level for the BTC/USD pair is at $9,250 (price congestion resistance).
Below the current price are multiple price congestion support at $7,850, $7,750 and $7,625. Below these support levels, the first strong support level is at $7,350 (price congestion support and EMA50). Below this level, the price could slide to the next healthy level around $6,000 (SMA100 and price congestion support).
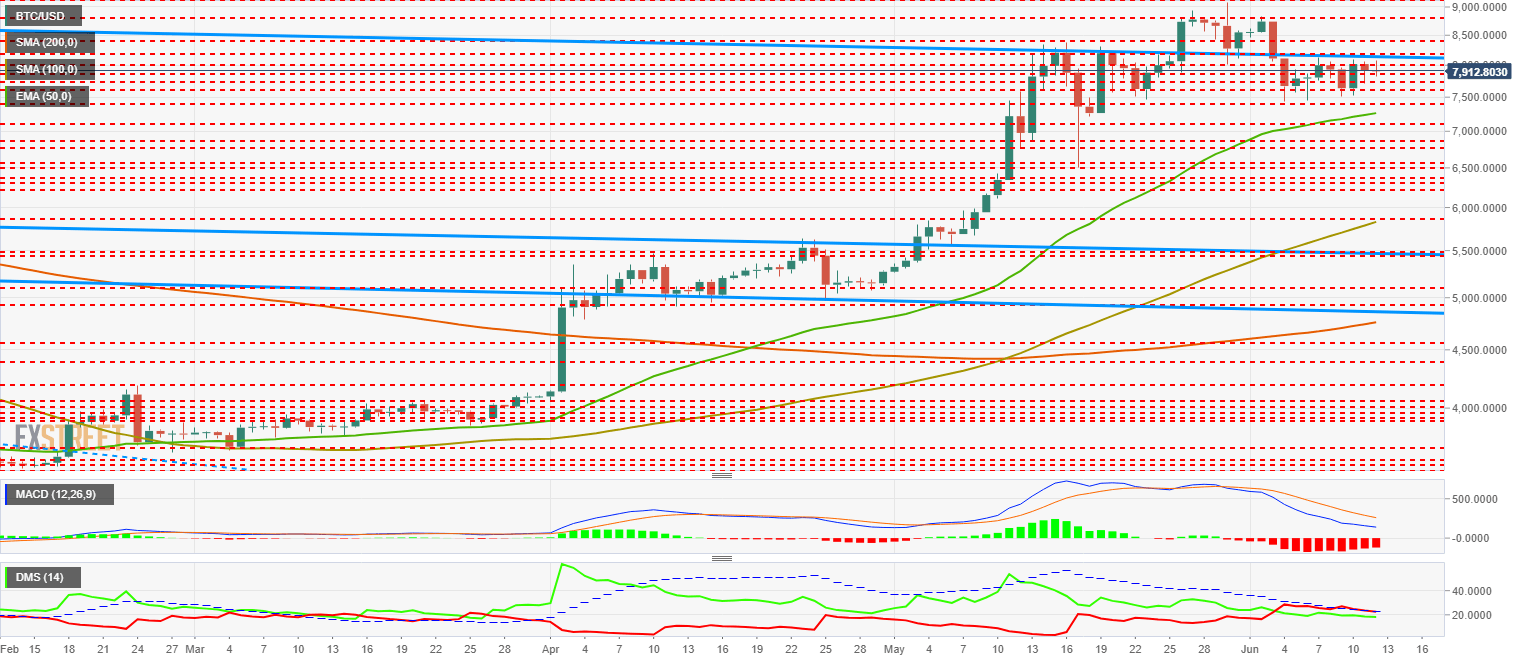
The MACD on the daily chart maintains its bearish profile although it appears to begin losing its bearish slope. As this process progresses, price volatility will likely increase.
The DMI on the daily chart shows how the bears are unable to move higher than the ADX line, which is a sign of weakness for the bearish side of the market. The bulls maintain a lateral bearish profile although moving very close to 20 – a level that signals the existence of an ongoing trend.
ETH/USD Daily Chart
ETH/USD is currently trading at $247.14 and suffers the same difficulty as BTC/USD in overcoming the first resistance level by $250 (price congestion resistance).
Above the current price, the next resistance level is at $260 (price congestion resistance), followed by $290 (price congestion resistance). The third resistance level for the ETH/USD pair is at $308 (price congestion resistance).
Below the current price, $238 awaits the coin (price congestion support) and $224 (EMA50 and price congestion support) afterward. The third level of support for the ETH/USD pair is at $215 (price congestion support).
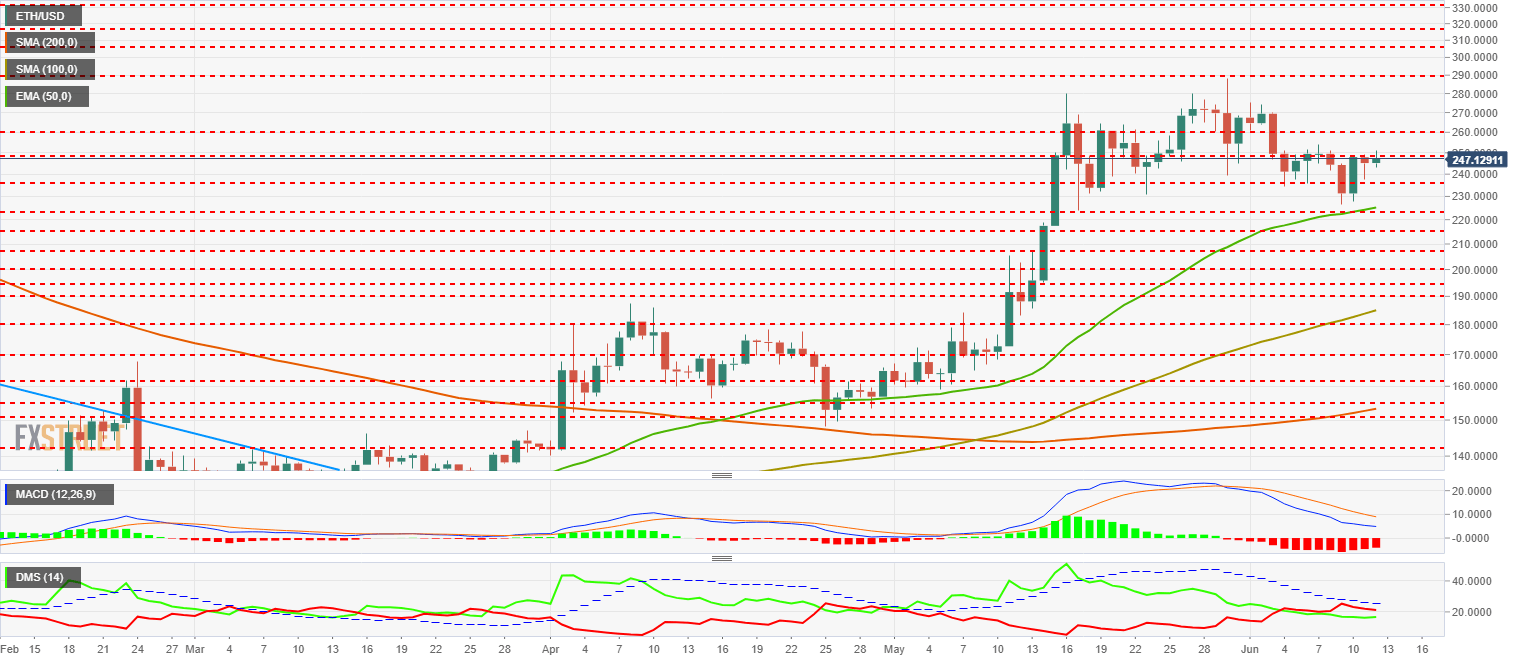
The MACD on the daily chart continues showing a bearish profile even though the slope is softening.
The DMI on the daily chart shows how the bears fail to break the ADX line – a new sign of weakness for the selling side – and similar to Bitcoin’s behavior. The bulls, on the other hand, show a marginal bullish inclination moving very close to the 20 levels of the indicator.
XRP/USD Daily Chart
XRP/USD is currently trading at $0.3915. Ripple’s XRP shows contradictions in the analysis and is in an ambiguous situation.
Above the current price, the first resistance level is $0.412 (price congestion resistance), then followed by $0.43 (price congestion resistance), and finally by $0.438 (price congestion resistance).
Below the current price, the first support level is $0.39 (price congestion support), then the second one is $0.38 (EMA50). The third one is $0.37 (double price congestion support).
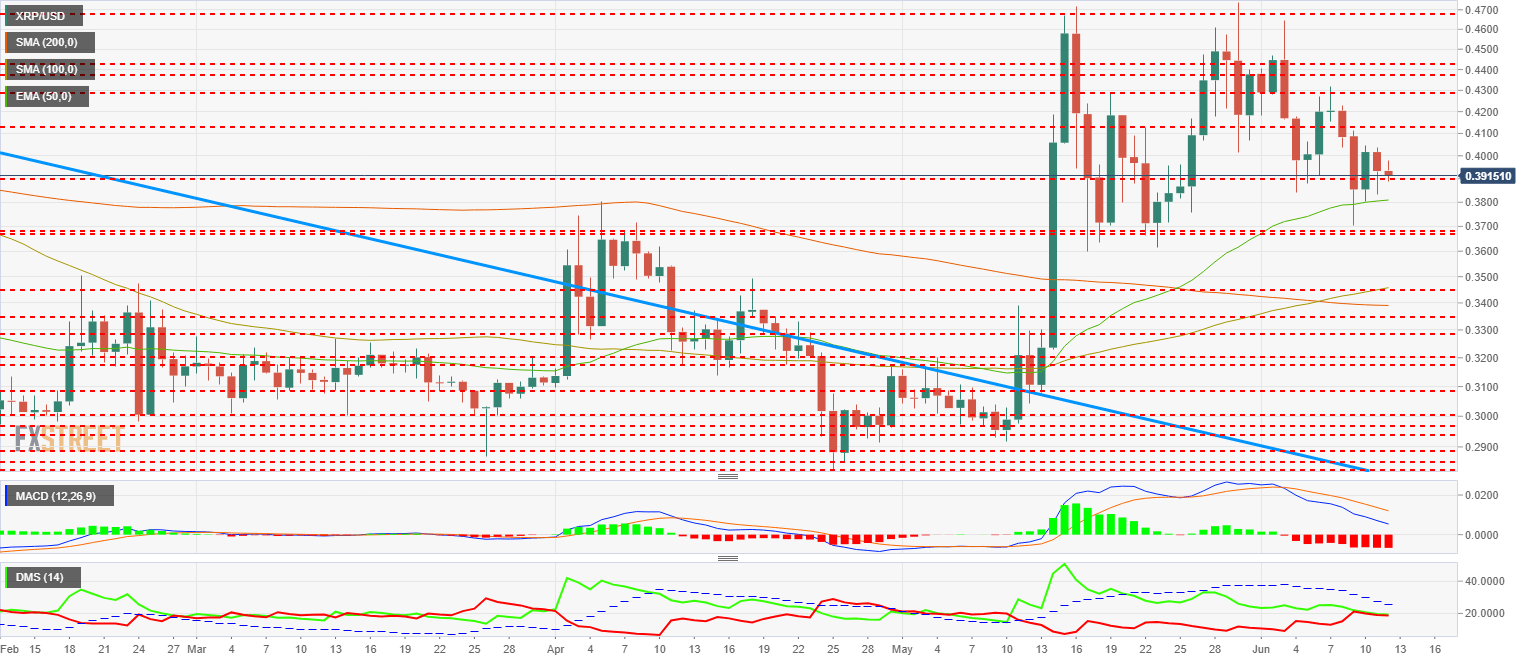
The MACD on the daily chart shows a profile that is very similar to Bitcoin or Ethereum – but without showing any decrease in the bearish slope.
On the other hand, the DMI shows that bulls and bears are completely tied and moving both sides of the market at indicator level 20. It is a structure that reflects the uncertainty about the XRP/USD pair.
Get 24/7 Crypto updates in our social media channels: Give us a follow at @FXSCrypto and our FXStreet Crypto Trading Telegram channel
http://platform.twitter.com/widgets.js

Be the first to comment