
There is an onslaught of bulls on Ethereum price which is up 114% in 2020 so far while trading at $281, a level last seen in early July last year.
However, according to Bloomberg’s GTI Global Strength Indicator that measures upwards and downward moves of closing prices, the coin has been at its “most overbought” level since last May.
As per the indicator, an asset is considered overbought if it surpasses 70 and oversold if the indicator is below 30. Ether went as high as 92.7 this week. The last time Ether was this overbought, the price lost over 55% of its value.
More Gains could still be in Store
“It is eye-opening the little run it has put together,” Edward Moya, a senior market analyst at Oanda Corp. told Bloomberg.
Ethereum’s rally could continue, he said, but “if bullish momentum gets out of control, Ether will likely find strong resistance in the $400-$440 region, roughly the midpoint of the record high seen in 2018.”
According to analyst Jacob Canfield, Eth/BTC has broken a major resistance level that served as support for the last two years and “a retest of .024 could be a great place to long.”
Overall the market is enjoying the alt season with Bitcoin being the lowest percentage gainer of 2020 among the top 20 coins except for the stablecoins. Altcoins like BSV and Dash have surged as much as 200% on a year-to-date basis.
Gas Price Jumps over 40% to Sept. Levels
Just like the price, the Ethereum Median Gas Price, one day MA, has also increased significantly, especially in the last 24 hours.
A jump of 40.9% can be seen as gas price went from 5.873 GWEI to 8.275 GWEI as noted by crypto data form Glassnode.
“Gas usage has hit highs not seen since September last year,” wrote Glassnode.
Towards the end of last month, we went as low as 2.4 GWEI from September’s high of 30 GWEI.
Active Addresses & Transaction Count Spikes Too
“Inline with ETH’s price rally, Ethereum network usage is on the rise,” points out Glassnode as, amidst these surges, two other network factors experienced a spike.
In the past seven days, Ethereum’s active addresses have increased by 26.7%, going from 180.7k to 217.2k. However, it’s lowest than the active addresses recorded on Jan. 20 at nearly 235k.
In June last year, this figure was at 363k while at its peak, the Ethereum Active addresses has been at nearly 662k that has been at the top of the bull cycle in Jan. 2018.
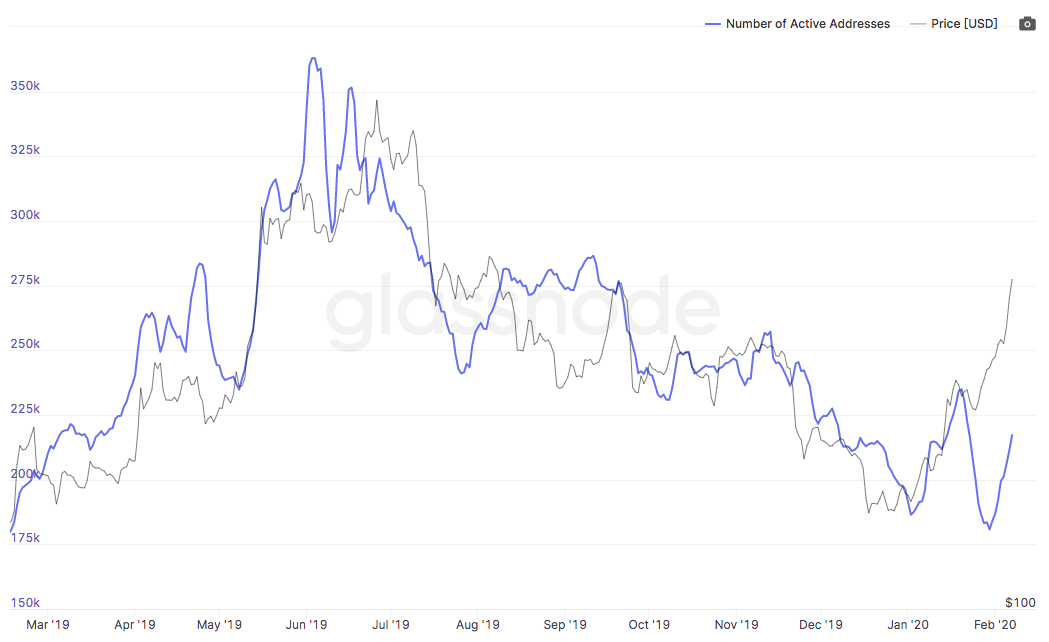
Transaction count is another fundamental that is up 20.77% from less than 500k last week to close to touching 700k.

Be the first to comment