

Multiple time-frame analysis of Litecoin using the Ichimoku Kinko Hyo system can provide useful short and long term price projections.
Litecoin Weekly Ichimoku Chart
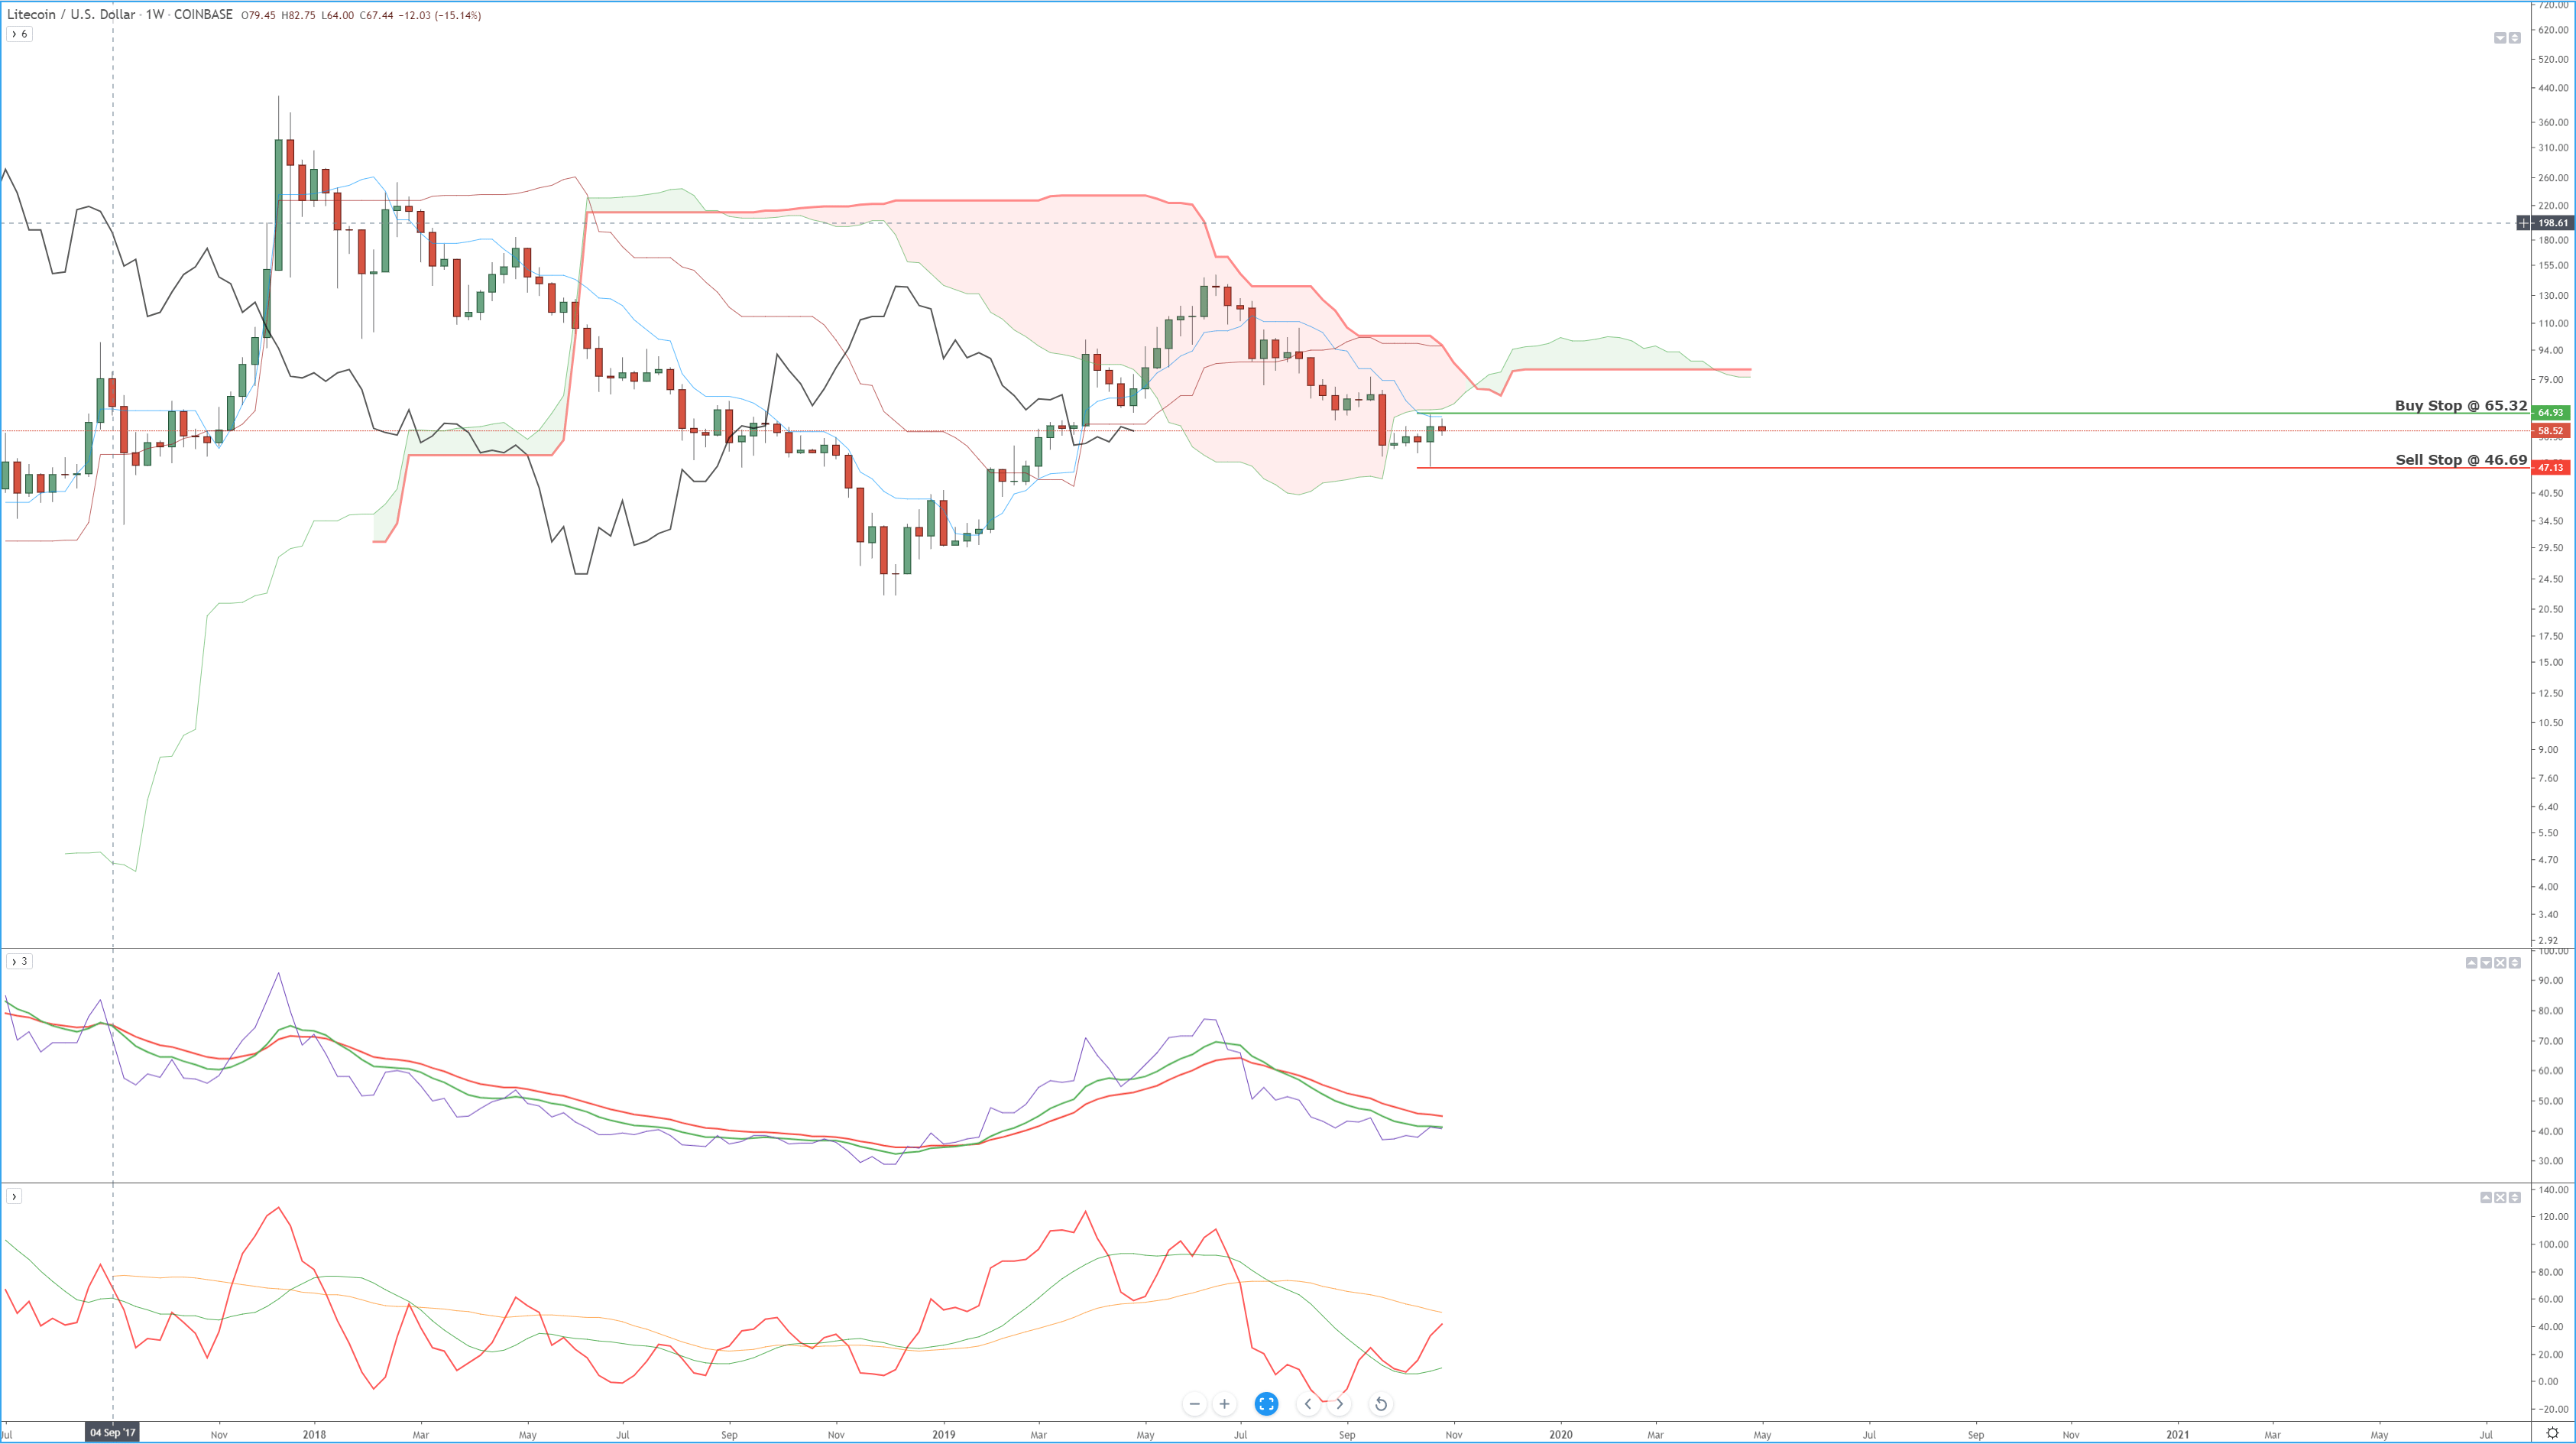
Litecoin (LTC) Weekly Ichimoku Chart.
Litecoin’s weekly Ichimoku chart shows inherent and robust bearish bias. The weekly Tenkan-Sen is below the Kijun-Sen with the Tenkan-Sen below the Kumo. The Kijun-Sen right on top of the current Kumo (Senkou Span B). One of the most bearish conditions on this weekly chart is price and the Chikou Span both below the Kumo. However, clear signals are indicating this move may be reversing. In about three weeks, Litecoin will be trading at the same time as a Kumo Twist (When Senkou Span A crosses above/below Senkou Span B). The cloud becomes increasingly thinner from this point on creating more natural conditions for Liteccoin to breakout higher. But the most precise signals that we may see higher prices is the existence of some extreme bullish divergence between price and the two oscillators below. Both the RSI and the Composite Index are registering bullish divergence against price – price has made lower lows while the RSI and Composite Index have created higher lows. More importantly, in my opinion, is the bullish divergence that exists between the RSI and the Composite Index. Divergences between the Composite Index and the RSI generally signal imminent changes in trend.
Litecoin Daily Chart
Litecoin (LTC) Daily Ichimoku Chart.
Litecoin’s daily chart does not display the same kind of clear signals that the Weekly chart provides. The past five trading days have seen Litecoin close and open at the same price level with no clear decision on trend continuation or reversal. One thing that should be taken away from this chart is that Litecoin is now trading at the higher number of consecutive days above the daily Kijun-Sen that it has since the significant drop in June. And the first actual tests of price hitting the bottom of the cloud (Senkou Span A) have occurred within the past six trading days – with four out of the six trading days piercing into the Kumo. The next near term bullish condition that must be met is for price to move above the daily Kumo. This should be an easily achievable event if the Chikou Span can remain above the candlesticks over the next five trading days.
Litecoin 4-hour chart
Litecoin (LTC) 4-Hour Ichimoku Chart.
Litecoin is undoubtedly displaying some bullish technical on the 4-hour chart. Price and the Chikou Span are both above the Kumo, but the Ichimoku system is showing clear signs of consolidation and indecision. The two oscillators below, though, hint at something different. First, the RSI is currently showing a ‘pinch’ – a pinch occurs when the RSI crosses the fast and slow-moving average (red and green) in a single candlestick. It should look as if all three lines are pinched together before the RSI moves up or down. The RSI is currently peaking just above the slow average and is above the fast average. The Composite Index shows an equally bullish indication here with the Composite Index crossing above both of its fast and slow moving average. There are some mixed divergence signals between price and the RSI. Hidden bearish divergence and bullish divergence both appear in the same time frame. There is a near equal interpretation that could be given in regards to the weight of these divergences – so they could be disregarded and are really just an example of what the Ichimoku system is already displaying: indecision.
Advertisement
Save money on your currency transfers with TorFX, voted International Money Transfer Provider of the Year 2016, 2017 and 2018. Their goal is to connect clients with ultra competitive exchange rates and a uniquely dedicated service whether they choose to trade online or over the telephone.
Find out more here.

Be the first to comment